LSA profitability test: Google Local Services Ads work for roofers when lead price, response speed, close rate, average job value, and gross margin hold together. Judge LSA by cost per sold job and gross profit after job costs — not the cost per lead.
Example math: a $75 valid lead at a 30% sold-job rate is about $250 per sold job; at 15% it is about $500. Whether that works depends on job value and margin, so the calculator below asks for both.
Model next: Compare LSA against other channels in the roofing ROI calculator, then the broader roofing lead cost calculator and marketing ROI breakdown.
Key takeaways
- LSA is lead-based — you pay for valid calls, messages, and booking leads, not clicks.
- Judge LSA by cost per sold job and gross profit, not the cost per lead.
- Example: a $75 valid lead at a 30% sold-job rate is about $250 per sold job.
- Google ranks LSA on your bid, responsiveness, reviews, relevance, and profile quality.
- The badge is now Google Verified — it replaced Google Guaranteed, and the money-back guarantee ended on October 20, 2025.
Short answer: Google Local Services Ads can be profitable for roofing companies, but only when cost per sold job and gross margin work — not when the cost per lead looks cheap. The metric that decides it is gross profit per sold job after labor, materials, and overhead, measured against LSA spend.
Most roofers judge LSA the wrong way first. They ask whether the lead price is fair. The better question is whether the team can answer fast, qualify clearly, and close enough valid leads to make the cost per sold job work. A $75 lead is cheap or expensive depending entirely on what happens after the phone rings.
LSA is lead-based, not click-based: you pay for valid leads, and Google does not charge for leads its systems judge invalid or low quality. A valid call, message, or booking request still needs fast handling. Slow response can waste the opportunity and missed calls may negatively affect the responsiveness signal Google uses in ad ranking.
An LSA lead contacts your business through your Google profile, but that does not make the shopper exclusive to you. Google explicitly considers whether a message lead contacted other Local Services advertisers when pricing that lead. If you are comparing LSA with marketplaces, focus on actual contact, appointment, and sold-job rates rather than assuming exclusivity. See the per-job math on Angi and HomeAdvisor, and the wider picture in how to get roofing leads.
Next Step
Use the core ROI tool alongside the LSA math
If the reader is searching for LSA profitability, they usually also need a broader ROI view and a true lead-cost comparison.
LSA vs Google Ads vs the Google Verified Badge
Three things get lumped together and should not be:
- Local Services Ads (LSA) can appear prominently in local results and are lead-based — you pay when a valid call, message, or booking lead comes through the ad.
- Google Ads (search PPC) are click-based — you pay for the click whether or not it becomes a lead. Their auction and ranking system is separate from LSA.
- The badge. Since October 20, 2025, Local Services has used a single Google Verified badge for eligible advertisers who complete screening and verification. It replaced badges including Google Guaranteed, and Google discontinued the associated money-back guarantee.
Why it matters for ROI: LSA's lead-based, response-weighted model is exactly why cost per sold job — not cost per click — is the number that decides whether the channel works.
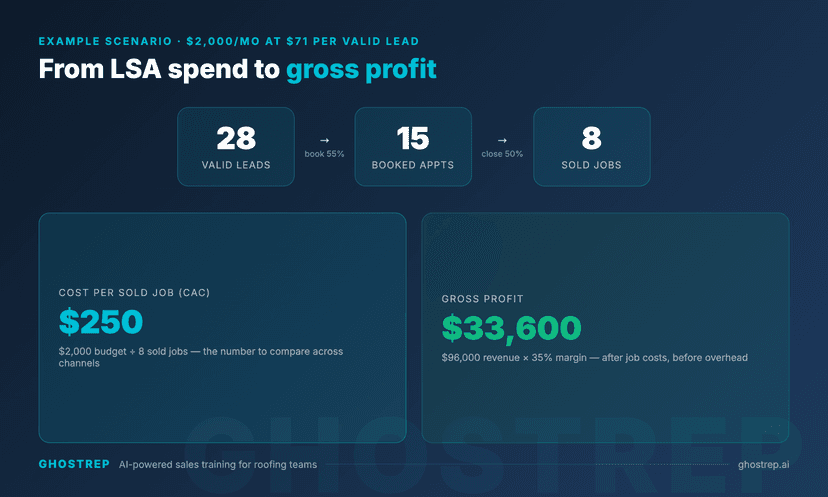
The calculator below models the full path from spend to profit, so revenue never gets mistaken for profit:
- Valid leads — budget divided by your cost per valid lead.
- Booked appointments — the share of valid leads your team actually books.
- Sold jobs — the share of appointments that close.
- Cost per sold job (CAC) — the number to compare against every other channel.
- Gross profit and gross-profit ROI — revenue times your gross margin, measured against spend.
The numbers above are an example scenario, not a benchmark. Actual LSA costs vary by service category, geography, competition, job type, and bidding mode, so run the model with your own inputs and trust cost per sold job as the comparison metric.
How to Read Your Result
Two outputs matter more than the rest. Cost per sold job is your true acquisition cost — the number to line up against referrals, SEO, canvassing, and marketplace leads.
Gross-profit ROI tells you whether the channel pays after job costs, but it flatters easily because roofing job values dwarf a $71 lead, so read it next to CAC, not on its own.
A simple gut check: cost per sold job should be a small slice of your gross profit per job. If a sold job costs $250 to acquire and throws off $4,000 in gross profit, LSA has room to scale.
If it costs $500 and the job clears $1,200 in gross profit, the channel is thin — close rate or job mix has to improve before you add budget.
What Changes the LSA Math
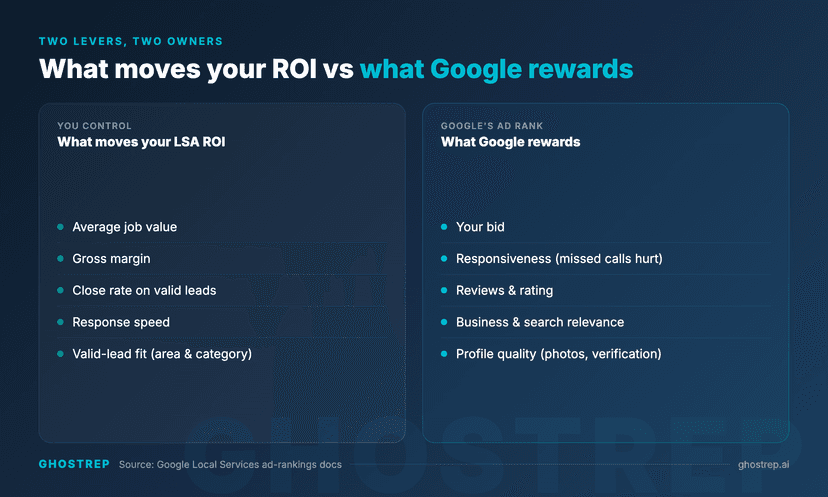
Two campaigns at the same lead cost can land in completely different places. Google says lead prices vary by location, job type, lead type, and bidding mode; the funnel after the lead arrives creates the rest of the difference. These levers move cost per sold job the most:
| Lever | Why it moves the math |
|---|---|
| Average job value | A $75 lead is trivial on a $16k replacement and heavy on a $5k repair. |
| Gross margin | Two companies at the same revenue keep very different profit. Margin, not revenue, pays the bills. |
| Close rate | Doubling close rate roughly halves cost per sold job on the same spend. |
| Response speed | Missed and slow-answered leads are paid-for leads that never book — and they lower your Google rank. |
| Valid-lead fit | Wrong-area or wrong-service contacts waste rep time even when Google does not charge for them. |
What Google Actually Rewards
You cannot negotiate your per-lead price, but you influence how many leads you get.
Per Google's Local Services ad-rankings documentation, rank is shaped by your bid, how likely your ad is to produce a lead, your responsiveness (missed calls count against you), the search context, your business relevance, how reachable you are, and profile quality — rating, number of reviews, average response time, high-quality images, and completed verification checks.
So bidding influences rank but is not the whole story. Reviews, response speed, and a complete profile matter, and Google notes higher-quality profiles "may rank higher and may also pay lower costs per lead." The bidding documentation covers the mechanics if you want them.
Google also automates much of lead-quality billing. Its lead documentation says leads judged invalid or low quality are not charged initially, while charged leads are reassessed over time and may receive automatic credits. That does not make every poor-fit inquiry free, so accurate service areas and categories still matter.
In practice, the highest-leverage moves are answering every LSA contact quickly, asking every finished customer for a review, and completing the profile with real photos and verification. Those feed rank and homeowner trust at once, and they cost nothing per lead.
Next Step
Compare Google LSA against the other paid channels
LSA queries are commercial. The next links should keep the reader inside the paid-channel comparison cluster instead of bouncing them out.
Roofing Breakpoints: Where LSA Wins or Loses
LSA economics swing on a few roofing-specific realities:
- Replacement vs repair. High-ticket replacement and insurance work can absorb a $250–$500 cost per sold job more easily than lower-ticket repairs.
- Storm surge vs steady retail. After a hail or wind event, search volume and intent spike, and a budget cap set for a normal week can run dry exactly when leads are most valuable.
- Response capacity. LSA rewards fast answers. If crews are on roofs and nobody owns the phone, response times slip and rank drops.
- Review profile. Rating and review count feed both rank and homeowner trust, so a thin review profile can raise your effective cost per sold job.
- Service area and job-type fit. Loose service areas and categories invite work you cannot serve. Tight settings keep the leads relevant.
When to Scale LSA
Scale when the math holds under real conditions: cost per sold job sits comfortably below your gross profit per job, response times stay fast as volume rises, and your close rate on valid leads is steady across reps — not carried by one closer.
When those hold, LSA is one of the easier paid channels to scale because the intent is already there.
When to Pause and Fix Operations First
Hold budget when leads are getting missed, when results vary sharply across reps, when jobs are too low-ticket to carry the cost per sold job, or when loose service areas pull in work you do not want. Raising budget on top of any of those just buys more waste.
The fix is almost never "bid more." It is answering faster, qualifying cleaner, and converting the calls you already paid for. If the economics never work — low job value, thin margins — organic search may fit better long-term; weigh it in the SEO vs Google Ads comparison.
If LSA leads feel expensive, do not just raise the budget. Fix the conversations that decide whether each valid lead becomes a sold job.
Have reps drill LSA and price objections in Role Play, use Echo for call and field visibility so managers hear what actually happened, and lean on AI Sales Coach for deal-specific guidance. Then compare LSA against your other channels in the ROI calculator before you scale spend.
Next Step
Make the paid-lead decision with job-level economics
Once you understand LSA performance, compare it against total lead cost and total marketing ROI before shifting spend.
Frequently Asked Questions
How much do Google Local Services Ads cost for roofing?
LSA is priced per lead, and the price varies by location, job type, lead type, and bidding mode. Treat any published per-lead range as an example — what matters is your cost per sold job, not the headline per-lead price.
How do roofers calculate LSA ROI?
Compare gross profit from sold LSA jobs against LSA spend. The most useful operating metric is cost per sold job — LSA spend divided by jobs won — because it compares directly against every other channel.
What is the difference between LSA lead cost and CAC?
Lead cost is what you pay for one valid lead. Customer acquisition cost is what you pay to win one sold job after booking and close rates are included, so a $75 lead at a 30% sold rate is about $250 per sold job.
Does bidding more get me more LSA leads?
Partly. Google lists your bid as one ranking factor alongside responsiveness, reviews, relevance, and profile quality, and notes stronger profiles may rank higher and pay less per lead. Fixing response speed and reviews often does more than raising your bid.
Free lead-generation resources
Turn traffic strategy into pipeline actions
Use free marketing and field tools to turn website, referral, and follow-up ideas into lead flow your reps can actually work.
Marketing tools
Generate ad copy, email sequences, company bios, and lead-conversion messaging for your market.
Browse marketing tools →Field sales tools
Create follow-up assets, texts, and homeowner-facing copy once a lead is already in motion.
Browse field sales tools →Job Intel
Give reps better customer context before the follow-up so lead quality is easier to convert.
See Job Intel →About the Author
Tim Nussbeck
Founder & CEO of GhostRep
20+ years in roofing and home improvement sales—knocking doors, running teams, and building practical coaching systems. Built GhostRep to give every rep access to the coaching top teams get.
LSA next step
Model LSA by sold jobs, not lead price
Use the ROI calculator to compare LSA against the rest of your lead mix. Book a walkthrough if the calculator shows response speed, objections, or close rate are suppressing ROI.
- ✓Best fit if LSA leads are showing up but cost per sold job is unclear.
- ✓Useful for deciding whether to raise budget or fix the sales process first.
- ✓Demo shows how GhostRep helps reps convert the paid opportunities they already receive.
Start Here
Compare LSA to every channel
Model lead volume, close rate, job value, and gross margin before raising spend.
Compare LSA to every channelNeed it mapped to your team?
Train reps on the price, timing, and trust objections that decide paid leads.
Practice LSA objectionsYou Might Also Like
Angi and HomeAdvisor share a parent. Compare published lead-sharing and credit terms, account fees, renewal risks, and a free contractor offer worksheet.
Read article →Enter your local HomeAdvisor lead quote, contact rate, held inspections, sold jobs, labor, and gross profit to plan a controlled roofing lead pilot.
Read article →Compare roofing SEO and Google Ads using fully loaded spend, qualified leads, signed and completed jobs, gross profit, cost per job, and true ROI.
Read article →