AI sales forecasting should not guess one roofing revenue number. Freeze the information available at a cutoff, forecast signing, production readiness, completion, and collection on their separate clocks, compare the model with a reproducible baseline and rep commit, and score it only after outcomes mature.
The useful standard is not “the AI sounded confident.” It is “a manager can reproduce what the system knew, what it predicted, what changed, and whether the result beat a simpler method.”
A roofing company can have $900,000 in open opportunity value, $420,000 in signed work, $260,000 accepted into production, and $180,000 expected to collect in the same month. Calling every number “the forecast” creates false precision. Each number answers a different operating question and matures on a different date.
The first AI use is often administrative: find missing dates, reconcile duplicate records, summarize source-linked history, or identify a stage whose evidence is incomplete. A probability model comes later. If the company cannot recreate last month's pipeline exactly as it existed last month, a more complex forecast will learn from a rewritten past.
Method and limits: Tim Nussbeck developed this roofing-operations framework and reviewed the cited forecasting, AI-governance, and NOAA sources on July 24, 2026. GhostRep did not inspect your CRM, production board, finance ledger, model, contracts, claims, workforce records, or jurisdiction. Every company, probability, dollar amount, and crew-day example below is synthetic—not a GhostRep result, roofing benchmark, forecast, confidence interval, accounting opinion, or legal advice.
Use Four Clocks, Not One Revenue Column
The 4-Clock Forecast separates the events that a roofing manager must plan. The clocks remain joined by stable opportunity and job IDs, but one clock cannot silently stand in for another.
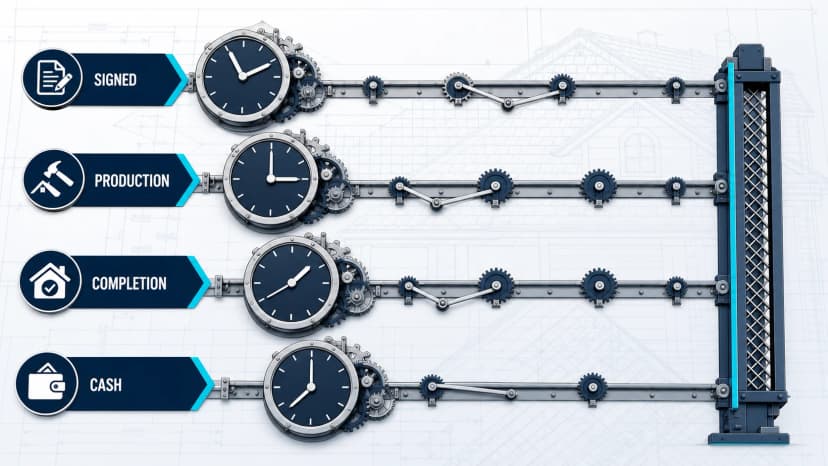
- Decision clock — will this company-accepted opportunity sign by the stated horizon? Use only the cutoff-safe stage, current proposal or scope evidence, next decision, stage age, source, job type, and comparable mature history. This clock does not prove production acceptance, completed revenue, collection, or causation.
- Readiness clock — will a signed job reach the company's production-acceptance boundary? Use the controlling agreement and scope sources, required evidence states, exception owner, and recorded acceptance event. This is not a coverage, code, engineering, safety, permit, financing, or legal determination.
- Production clock — can accepted work complete inside the horizon? Use job type, estimated crew-days, schedule, materials, permits, access, known constraints, quality history, and available capacity. Probability-weighted work still cannot be scheduled as fractional roofs, and the model cannot promise weather.
- Cash clock — what is expected to become collectible and actually collect by the horizon? Use the company's amount policy, completion and invoice states, payment terms, collection history, and finance record. This clock does not decide accrual or tax treatment, carrier action, customer ability to pay, or causal ROI.
Publish the outputs with their nouns: expected signed contract value, expected completed jobs or value, and expected collected cash. “Booked” is too ambiguous: one roofing team may use it for an appointment, another for a signed agreement, and another for a production slot.
The roofing production-handoff field guide owns the evidence contract between signed work and production acceptance. This forecast uses that acceptance state; it does not recreate the handoff process or decide technical questions.
Freeze a Forecast Contract Before Calculating
A forecast begins with an as-of record, not a formula. Write the contract before reviewing the result. Otherwise a manager can move the cutoff, horizon, stage definition, amount, or outcome after reality is known.
A filled synthetic contract for an August operating review would read like this:
- As-of cutoff
- July 20, 2026 at 5:00 p.m. Central. Require an immutable snapshot or reconstructable change history so later events cannot leak backward.
- Horizon and targets
- Through August 31, 2026; sign, become production-ready, complete, and collect by that horizon. Every event needs its own timestamp and source.
- Amount definition
- The company-approved expected signed or collectible amount under a named policy. Preserve the amount source and version; exclude speculative additions.
- Cohort
- One market, retail replacement motion, comparable job types, and stated stage-and-age rules. Show exclusions and sparse slices instead of blending unrelated motions.
- Maturity rule
- October 31, 2026 for final cash scoring. Until then, keep open, canceled, completed, and collected states distinct rather than labeling unresolved work a failure.
- Methods
- Seasonal-naïve v1, evidence-weighted v2, model v3, rep commit, and final override. Preserve every original output so the published result can be audited.
- Owner and allowed use
- Sales operations publishes; operations and finance review their clocks. Document permitted actions and fallback without delegating the decision to software.
The sales pipeline template owns stages and exit evidence after a company-accepted booked opportunity. Lead qualification belongs before that boundary. Do not add a vague “Qualified” forecast stage if it means “appointment not yet accepted into the sales pipeline.” A forecast cannot repair an undefined funnel.
Make AI Beat a Baseline Before It Earns a Decision
Start with a method a manager can reproduce in a spreadsheet. The simplest useful baseline may be the last comparable mature period, a seasonal-naïve value, or evidence-weighted item math. The exact rule is a company choice; the important part is freezing it before the model result is known.
Forecasting research treats simple methods as real competitors, not straw men. The current online edition of Forecasting: Principles and Practice describes benchmark methods, prediction intervals, and accuracy evaluation as core tools. An AI model that cannot improve the operating decision beyond a declared baseline adds complexity, not forecasting skill.
Keep six records separate so one method cannot quietly rewrite another:
- Naïve baseline: a declared comparable-period, seasonal-naïve, or run-rate rule. It is the transparent minimum competitor, but it can miss current pipeline evidence or structural change.
- Evidence-weighted pipeline: item amount multiplied by a horizon-specific probability from cutoff-safe evidence. Use it only when stages, ages, sources, and outcomes are consistent; do not substitute an eventual close rate for a month-end probability.
- Rep commit: the rep's dated event-and-amount forecast plus a source-linked reason. Preserve it for field context without allowing optimism, sandbagging, inconsistent labels, or retrospective edits to disappear.
- AI or model estimate: a versioned model using only features available at the cutoff. It earns use only when rolling backtests show value beyond the baseline and when leakage, drift, opacity, and sparse segments are controlled.
- Manager override: a named final decision that preserves the model output, change direction, amount, and source-linked reason. It should add missing evidence or capacity—not hide model failure.
- Operating scenario: downside, base, or upside changes tied to named demand, timing, capacity, or cash assumptions. Do not present an arbitrary plus-or-minus band as a calibrated interval.
A quota is not a forecast. The sales quota tool owns target-setting; a forecast estimates an event under known evidence and uncertainty. Raising the quota does not raise the probability, and lowering the forecast does not excuse a controllable activity gap.
Use Horizon-Specific Probabilities and Cutoff-Safe Evidence
Let t be the cutoff, h the horizon, and It only the information available at the cutoff. For an open opportunity, the probability must mean:
psign,i(h,t) = probability that opportunity i signs by h, given that it was not signed at t and given only It.
That is different from eventual win rate. If 60% of mature proposal-stage opportunities eventually sign, that does not establish a 60% chance that a current proposal will sign before August 31. Stage age, job type, source, customer decision, evidence state, season, and the length of the remaining horizon can change the estimate.
Expected signed amount by h = sum across opportunities of expected signed amount multiplied by the sign-by-horizon event.
An item approximation—expected amount × sign-by-horizon probability—is useful when its amount definition and probability version are declared. Preserve the unweighted opportunity value beside it. Expected value is not a schedule: an operations manager cannot install 0.55 of a roof because the sales model assigns a 0.55 sign probability.
For collected cash, model the joint path. If the company factors the calculation, every later probability must be conditional and horizon-specific:
Expected cash ≈ expected collectible amount × P(sign by h) × P(complete by h | sign by h) × P(collect by h | complete by h).
This is a conditional approximation, not an independence claim. Blanket completion and collection rates from unrelated cohorts can make the formula look precise while using incompatible denominators.
Time-ordered evaluation must not train on the future. Rolling-origin time-series cross-validation uses only observations before each test point. Scikit-learn's official data-leakage guidance likewise warns that preprocessing and feature selection must be learned from training data, not the held-out future.
Work One Synthetic Opportunity Through All Four Clocks
Use the July 20 cutoff and August 31 horizon from the forecast contract. A fictional retail replacement opportunity has a company-approved expected signed and collectible amount of $18,000. The following values are invented solely to demonstrate the equation.
| Step | Synthetic input | Calculation | Expected amount |
|---|---|---|---|
| Unweighted opportunity | Company-approved amount | $18,000 | $18,000.00 |
| Sign by August 31 | 0.55 horizon-specific probability | $18,000 × 0.55 | $9,900.00 expected signed |
| Complete by August 31 if signed by then | 0.60 conditional probability | $9,900 × 0.60 | $5,940.00 expected completed |
| Collect by August 31 if completed by then | 0.92 conditional probability | $5,940 × 0.92 | $5,464.80 expected cash |
The $5,464.80 is neither promised cash nor a claim that one job can be fractionally completed. It is the expected contribution of this item to a portfolio forecast under three declared synthetic probabilities. Scheduling still needs discrete job scenarios, readiness evidence, and capacity.
Put Production Capacity Between Signed Work and Cash
More expected signs can increase the published sales forecast while making the completion forecast less credible. Convert production-ready probability into the capacity unit operations actually manages—such as estimated crew-days by job type—then compare it with a declared availability scenario.
Expected required crew-days = sum of probability that each job becomes production-ready in the horizon × that job's estimated crew-days.
Capacity load = expected required crew-days ÷ available crew-days under the declared scenario.
Synthetic capacity check: begin with 10.0 planned crew-days from the approved schedule. Remove one known absence once. Then remove a named 2.0-day allowance for weather, access, material, permit, or another declared scenario—not a universal weather benchmark.
Available crew-days = 10 − 1 − 2 = 7.0
The probability-weighted jobs require 8.4 crew-days. That produces 8.4 ÷ 7.0 = 1.20 capacity load. The expected load is 20% above the declared scenario ceiling, so the published forecast needs an operating response rather than a hidden probability adjustment.
A 1.20 load is not permission to lower probabilities until the worksheet fits. Operations must choose and document a response: move work outside the horizon, add verified capacity, change a named scenario assumption, or publish the overload risk.
NOAA's U.S. Climate Normals describe historical typical conditions. NOAA's explanation of monthly and seasonal outlooks says those products show probabilities for broad above-, near-, or below-normal categories—not exact daily amounts. Neither source establishes workable crew-days, hail at an address, roof damage, leads, signatures, or revenue.
If a weather allowance already reduces available crew-days, do not use the same effect to reduce item completion probabilities again without a documented reason. The storm-season revenue model owns the separate demand, funnel, job-mix, and capacity scenario; this article only reconciles that scenario with the frozen forecast.
Build a Forecast Evidence Ledger
The ledger preserves what each method knew and said. Use fictional data in training and public examples; keep live customer, claim, financing, payment, location, and worker data inside the company's approved systems.
A reproducible evidence ledger answers six questions for every item:
- Identity: Do the stable ID, cutoff, horizon, target event, amount definition, cohort, and maturity date make every method and later actual answer the same question?
- Cutoff evidence: Could the source, market, job type, stage, stage age, evidence state, next action, date, amount, and version have been known at the cutoff? Link the CRM record to the controlling source.
- Method outputs: Are the naïve value, evidence-weighted probability and value, rep commit, model version, interval, and scenario stored as separate immutable records?
- Operations overlay: Are readiness state, crew-days, capacity scenario, and completion and collection assumptions owned by production or finance, conditional on the correct prior event, and free from double counting?
- Override: Does the final forecast preserve its difference from the model, source-linked reason, authorized owner, and timestamp so the company can later learn whether that override pattern helped?
- Mature actual: Are sign, readiness, completion, collection date and amount, cancel or unresolved state, and definition versions joined only after the declared maturity rule?
The sales forecast template owns the reusable blank artifact. This article owns the method and audit standard. Do not turn a public template into a store of live opportunity data.
Let AI Assist, Abstain, and Fail Safely
NIST's voluntary AI Risk Management Framework identifies validity/reliability, accountability/transparency, explainability, privacy, and human oversight as context-dependent trustworthiness characteristics. Its Core calls for documented roles, data suitability, testing/evaluation/validation/verification, limitations, and monitoring. Those principles do not prove a roofing forecast accurate; they explain why the company must define the use and evidence before deployment.
Good assistive uses
- Extract candidate fields when each one links to a permitted controlling source and remains subject to review.
- Flag missing, stale, duplicate, future-dated, or internally inconsistent records.
- Estimate a probability only when the target, horizon, cutoff-safe cohort, model version, calibration, limits, and baseline are documented.
- Explain an approved scenario by naming which input changed.
Mandatory abstention
Stop when the source is missing, contradictory, private beyond purpose, or requires specialist interpretation; when the slice is unsupported, outside scope, drifting, or cannot be reconstructed; or when the system would invent weather, capacity, amount, coverage, financing, or next-step evidence.
AI must not auto-close an opportunity or turn forecasting into worker ranking, lead allocation, compensation, discipline, termination, or another employment decision.
What the person still owns
A named person approves or corrects extracted fields without erasing source history, resolves data exceptions, decides whether an estimate is fit for the declared use, approves assumptions and operating responses, and handles employment decisions through a separate accountable and job-related process.
NIST's Generative AI Profile describes confabulation: a system can confidently produce false content or logic. Use a language model for source-linked extraction, summarization, exception explanation, and approved scenario narration—not as an unexplained probability generator.
The AI sales-manager guide owns the broader use-case and governance map. Forecasting must not become a back door to employee scoring or automated lead allocation.
Score Probability, Amount, Range, and Overrides After Maturity
Choose the metric before seeing the actual. No single measure answers every question.
- Signed error: Forecast − Actual. Under this declared convention, positive values mean overforecasting.
- Bias: mean signed error across mature forecasts. Repeated positive bias reveals systematic overforecasting even when some errors cancel.
- MAE: mean absolute dollar error. It is easy to explain and keeps the business scale visible.
- MASE: mean absolute error divided by the declared naïve error when that denominator is nonzero. Hyndman and Koehler's forecast-accuracy paper explains why percentage measures can become undefined or misleading near zero and proposes scaled error for cross-series comparison.
- Brier score: mean of (probability − outcome)2 for mature event probabilities. A lower score is better for the same target and cohort, but calibration and decision value still need inspection.
- Interval coverage: the share of mature actuals inside the frozen interval, reported with mean interval width. A very wide interval can cover often while being useless.
- Override value added: |Model − Actual| − |Final override − Actual|. Positive means that override helped; negative means it hurt.
Scikit-learn's official calibration guidance explains the interpretation: among suitable cases assigned a probability near 0.8, the event should occur near 80% over enough relevant mature observations. Calibration is not the same as ranking skill.
Monthly scoring sequence:
- Confirm the question. For example: July 20 cutoff, August 31 horizon, and “sign by horizon” target. Reject mixed dates or events.
- Preserve every forecast. Keep the baseline, model, rep, and final values separately—for example, $82k, $91k, $105k, and $96k—so the team can see which method changed the published decision.
- Name the uncertainty. A $72k–$112k declared 80% interval must be separated from a merely named downside or upside scenario.
- Wait for the mature actual. If the frozen event-and-amount rule produces $88k, keep unresolved records open rather than forcing a result.
- Calculate direction and size. The $96k final against an $88k actual has +$8k signed error and $8k absolute error. Review repeated bias by horizon and cohort.
- Score the override. |$91k−$88k| − |$96k−$88k| = −$5k, so this override hurt the mature forecast. Inspect the same override reason across many cases before drawing a conclusion.
- Record process versions. If stage v4, model v3, or source mapping v2 changed comparability, start a new clean evaluation segment instead of blending unlike periods.
The values in this scorecard are synthetic and are not the worked $18,000 item. Keep item probability evaluation and aggregate amount error in connected but separate views. The sales KPI scorecard owns reusable metric definitions so a weekly review cannot silently change the denominator.
Run a Rolling-Origin Backtest
- Select a historical cutoff. Recreate only the data, stage definitions, and source versions available then.
- Freeze the same target and horizon used in operations. A one-week sign forecast and a 90-day cash forecast are different tests.
- Train or fit only on earlier mature outcomes. Do not let current final stage, later notes, future weather, or later production state enter.
- Generate every competitor. Save the naïve baseline, evidence-weighted value, rep commit if one existed, model estimate, interval/scenario, and final override.
- Advance the cutoff. Repeat across enough relevant periods to observe drift and uncertainty; no public universal minimum applies.
- Wait for maturity. Join the correct sign, readiness, completion, and collection actuals without relabeling unresolved work as loss.
- Compare by horizon and useful cohort. Report error and calibration, but suppress slices too small to support an operating conclusion or safe employee interpretation.
- Decide the allowed use. A model may help flag risk without being reliable enough to set a cash plan.
IBM researchers have defined opportunity win propensity as a probability of winning within a specified time window in their sales-opportunity research. That supports the horizon-specific question, not a transferable roofing coefficient or accuracy claim.
Run a Weekly Review Without Reading Every Deal
- Freeze the cutoff and verify data delivery before looking at the headline number.
- Review missing, contradictory, future-dated, duplicated, and out-of-scope records first.
- Compare the naïve, evidence-weighted, rep, model, and prior published forecasts.
- Inspect the largest item changes and the source evidence behind them.
- Reconcile production-readiness exceptions and the discrete capacity scenario.
- Reconcile cash timing with finance without asking sales to decide accounting or claim questions.
- Record any override, source-linked reason, owner, version, and permitted operating action.
- After maturity, score the prior forecast before retraining or changing definitions.
The sales meeting agenda owns the reusable meeting artifact. The remote roofing sales-management guide owns distributed cadence and source-of-truth practices. This page supplies the forecast decision inside those routines.
Use Stop, Repair, Baseline, and Pilot Gates
Stop when the source is missing or prohibited, the model exposes data beyond its purpose, current state leaked into a historical cutoff, a specialist decision is being inferred, the output would automate an employment decision, or the integration cannot fail safely.
Repair the record and restart a clean evaluation period when stages, amount definitions, source mappings, duplicate rules, time zones, or outcome timestamps change. Preserve the failed period and version; do not blend it into the new one.
Stay with a transparent baseline when the company cannot reconstruct snapshots, outcomes are immature, cohorts are sparse, or the AI model does not add decision value. A spreadsheet the team understands is better than an unvalidated score.
Pilot a bounded AI use when the target, horizon, data lineage, baseline, human owner, abstention rule, security boundary, and rollback are documented. Begin with exception detection or source-linked extraction before allowing probabilities to affect staffing, cash, or marketing decisions.
Expand the allowed use only after rolling mature results remain fit for that specific purpose under current conditions. Forecast skill can deteriorate when sources, markets, products, behavior, or operating constraints change.
Frequently Asked Questions
How accurate is AI sales forecasting for a roofing company?
There is no defensible universal accuracy percentage. Define the event, cutoff, horizon, amount, cohort, and maturity rule, then compare the frozen AI/model result with a simple baseline over rolling mature periods. Report dollar error, bias, probability calibration, and range coverage for the specific allowed use.
What should a small roofing company use first?
Use evidence-defined post-booking stages, stable IDs, source-linked next steps, a frozen weekly snapshot, and a reproducible spreadsheet baseline. Add AI first for data-quality exceptions or source-linked summaries. Add probability estimates only when cutoff-safe outcomes can be backtested.
Is stage probability the same as close rate?
No. Eventual close rate is the share of a mature cohort that eventually signed. Forecast probability asks whether this item will sign by a specific horizon given only information at the cutoff. Stage age, remaining horizon, source, job type, and evidence can make those values different.
Is signed contract value the same as revenue or cash?
No. Keep the company's accounting terms precise. A signed agreement may still face readiness, cancellation, production, invoicing, change, and collection timing. Publish signed, completed, and collected outputs separately and let finance own accounting treatment.
Can weather AI predict roofing revenue?
Weather information can support a named demand or capacity scenario. It does not prove a roof was damaged, a lead will exist, work will sign, a day will be workable, or cash will collect. NOAA's Storm Events FAQ also notes that its retrospective database is typically updated 75–90 days after a data month and has stated source limitations.
Should a forecast remove rep judgment?
No. Preserve a dated rep commit and its evidence separately from the baseline and model. Then evaluate whether repeated rep or manager overrides add value after outcomes mature. Do not use forecast differences alone as an employee verdict.
Is sales-team capacity the same as production capacity?
No. The roofing sales-team capacity calculator estimates productive sales seats from appointment and conversion inputs. Production capacity concerns accepted jobs, job types, crews, materials, access, and workdays. A company can have enough reps and still overload production.
Do I need the forecast template or this guide?
Use this guide to define the method, evidence, evaluation, and AI boundaries. Use the forecast template for the reusable working structure. Neither tool watches a live CRM, validates a model, schedules work, changes records, or guarantees a result.
Source note: Forecasting, NIST AI-governance, IBM research, scikit-learn methodology, and NOAA sources were reviewed July 24, 2026. Recheck software, model, weather, privacy, employment, accounting, insurance, and legal requirements before operational use.
Free tools for sales managers
Turn this into a manager workflow
Use free management and operations tools to turn coaching ideas into repeatable systems for your reps and managers.
Management tools
Use 1-on-1 scripts, meeting agendas, forecast templates, and escalation tools.
Browse management tools →Operations tools
Build scorecards, SOPs, pipeline templates, and review workflows your team can run every week.
Browse operations tools →AI Sales Coach
Give reps coaching based on real performance data instead of waiting for the next ride-along.
See AI Sales Coach →About the Author
Tim Nussbeck
Founder & CEO of GhostRep
20+ years in roofing and home improvement sales—knocking doors, running teams, and building practical coaching systems. Built GhostRep to give every rep access to the coaching top teams get.
Manager next step
Turn this into a manager workflow your team can repeat
Use the management tools if you need a practical coaching or accountability system first. Book a walkthrough if you want GhostRep tied to rep performance and live coaching.
- ✓Best fit if coaching is inconsistent across reps and managers.
- ✓Useful for 1-on-1s, scorecards, and weekly operating rhythms.
- ✓Demo shows how AI Sales Coach turns performance data into specific guidance.
Start Here
Browse management tools
Open scorecards, coaching docs, forecast templates, and manager workflows.
Browse management toolsNeed it mapped to your team?
Talk through your current workflow, traffic mix, and where GhostRep fits before you change anything.
Book a 15-minute walkthroughYou Might Also Like
See seven useful AI sales manager workflows for roofers, what AI should never own, and a practical pilot and buyer checklist.
Read article →Learn how to take roofing sales call notes that separate sourced facts, customer statements, unknowns, commitments, and the next owned action.
Read article →Use a seven-gate roofing CRM rollout plan for workflow mapping, configuration, pilot testing, role training, go-live, and the first 30/60/90 days.
Read article →